VMware Packet Capturing for Network Engineers

While working at VMware I learned the value of capturing packets inside of an ESXi hypervisor. I used packet capture so frequently I memorized the commands. Let me explain the basics of ESXi packet capture in this post.
A network engineer's most precise tool to figure out what is happening in the network is always going to be a packet capture. Fortunately, ESXi hypervisors make this easy. My baseline of comparison? Packet capturing on physical networking infrastructure, such as a Cisco switch. With Cisco, the process entails creating a monitor port, connecting a cable to the switch, attaching a computer with a packet sniffer and finally, collecting and analyzing the packets with an application such as Wireshark. With ESXi packet capturing, the most cumbersome aspect is remembering the incredibly long commands!
My pcap (packet capture) commands can be referenced in VMware's official documentation:
Turn to page 224 and read from heading "Capturing and Tracing Network Packets by Using the pktcap-uw utility"
With that out of the way, I'll jump into my lab and give an example of how to use the packet capture commands. I've selected the two VMs below as my packet source and destination.

If I were helping a user or cloud admin troubleshoot their problem, first I would ask them for a source and destination ip address. You can quickly translate ip addresses to VM names using the vCenter UI.
Lets say an admin tells me their source ip address is 192.168.101.10. Just pop it into the vCenter search bar:

You'll want to locate the ESXi host that is running the VM, then ssh to that ESXi host.

I'm not gonna show the steps for finding the destination VM's host as I trust you can follow this same process for that. Lets verify the ip addressing of the VMs then send some ping packets between them.


Ok, so we have identified a source and destination VM for the ip traffic, generated some ICMP packets. Lets look at the anatomy of virtualized networking so we can figure out which capture point we will use to capture packets!
Right-mouse click the below diagrams to view the anatomy of virtualized networking components. Here we look at a VM named Ubuntu-SFTP. We look at its vnic, dvswitchport and the physical nic it is associated with on the server.


Next, I always check the ESXi version since it has implications for the functionality of the packet capture. Prior to ESXi 6.7, the packet capture command could only capture packets unidirectionally. In 6.7 and later, the packet capture command can capture bi-directionally if you want that. At the time of this writing, ESXi 6.7 is set to be end of support in a month (October 15, 2022). So if you're still using ESXi 6.5 or older for production workloads, I'm just gonna ask why are you doing that?
Check the version of your ESXi host with:
vmware -vl

We've confirmed our hypervisor can perform bidirectional packet captures. The virtual machine has a virtual nic which is attached to a virtual switch port. For the packet capture to work, we need to tell the command what ports on the virtual switch to capture. So we have to do a little discovery before we can build the capture command.
To find the virtual port id of the VM, use the following command:

In a production environment, you may have 60+ VMs running on the hypervisor. This might make it difficult to spot the VM you want to packet capture. Use a grep command with the name of the VM to narrow down your results. Remember that with grep, you don't need to know the full name of the VM.

At this point I normally open a notepad, copy in the data here and build the commands that I want. Once the command is ready, I copy and paste it to the hypervisor cli.

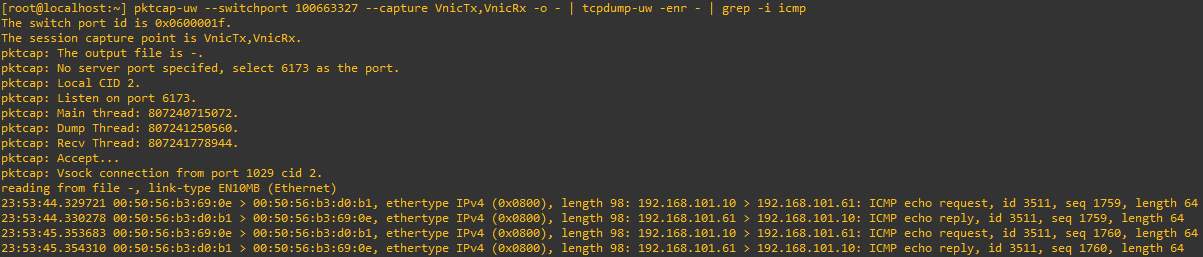
pktcap-uw --switchport 100663327 --capture VnicTx,VnicRx -o - | tcpdump-uw -enr -
This command is about as vanilla as you can get with ESXi packet capturing. The tool is much more flexible than what you see above, but we have to start somewhere, right? The packet output from this command will dump to the ssh session as text. There are ways to send this data to a file for examining in a packet analysis tool. We'll go over that later. Lets have a look at the cli output first!

End the packet capture with ctrl+c. You can see that we have captured more data than the ICMP traffic that we generated earlier. I wasn't expecting this, but I decided to keep the output to show one of the tools I use to reduce the verbosity of the pcap output. You can pipe the captured packets to grep and filter just on icmp traffic. If you're just learning how to pcap on ESXi, this should be enough to get you going.
Now for the DEEP dive! You can see the mostly full list of parameters this command has by typing:
pktcap-uw --help
As this blog post is a resource I intend to reference in the future, I'll go ahead and list out the full help file here.
[root@localhost:~] pktcap-uw --help
Packet Capture and Trace command usage:
== Create session to capture packets ==
pktcap-uw [--capture <capture point>[,capture point]...
| [--dir <0|input|1|output|2|inputAndOutput>]
[--stage <0|pre|1|post>] [-K|--kernelside]]
[--switchport <PortID> | --vmk <vmknic> | --uplink <vmnic> |
--fcport [fastpathSwitchID.]<PortID> |
--dvfilter <filter name> |
--overlay <overlay class name>]
[--lifID <lif id for vdr>]
[-f [module name.]<function name>[:offset]]
[-AFhP] [-p|--port <Socket PORT>]
[-c|--count <number>] [-s|--snapLen <length>]
[-G <seconds>]
[-C <file_size>]
[-o|--outfile <FILE>] [--console]
[Flow filter options]
== Create session to trace packets path ==
it can trace up to 32 level from pkt allocation and record up to 12 IOChain or portID
pktcap-uw --trace
[-AFhP] [-p|--port <Socket PORT>]
[-c|--count <number>] [-s|--snapLen <length>]
[-G <seconds>]
[-C <file_size>]
[-o|--outfile <FILE>] [--console]
[Flow filter options]
The command options:
-p, --port <Socket PORT>
Specify the port number of vsocket server.
-G, <seconds>
Specify the seconds to rotate the outfile.
-C, <file_size MB>
-o, --outfile <FILE>
Specify the file name to dump the packets. If unset,
output to console by default. If '-', then stdout is used.
-P, --ng (only working with '-o')
Using the pcapng format to dump into the file.
--console (by default if without '-o')
Output the captured packet info to console.
-s, --snaplen <length>
Only capture the first <length> packet buffer.
The minimum snap length is 24 bytes. However, setting
snaplen to 0 will capture entire packet.
-c, --count <NUMBER>
How many count packets to capture.
-h
Print this help.
-A, --availpoints
List all capture points supported.
-F
List all dynamic capture point functions supported.
-4
Capture only IPv4 Packet.
-6
Capture only IPv6 Packet.
--capture <capture point>
Specify the capture point. Use '-A' to get the list.
If not specified, will select the capture point
by --dir and --stage setting
The switch port options:
(for Port, Uplink and Etherswitch related capture points)
--switchport <port ID>
Specify the switch port by ID
--fcport [fastpathSwitchID.]<port ID>
Specify the fastpath port by ID
--lifID <lif ID>
Specify the logical interface id of VDR port
--vmk <vmk NIC>
Specify the switch port by vmk NIC
--uplink <vmnic>
Specify the switch port by vmnic
The capture point auto selection options without --capture:
--dir <0|input|1|output|2|inputAndOutput> (for --switchport, --vmk, --uplink, --fcport)
The direction of flow, with respect to the vswitch:
0- Input: to vswitch (Default), 1- Output: from vswitch, 2- Input and Output
--stage <0|pre|1|post> (for --switchport, --vmk, --uplink, --dvfilter, --overlay)
The stage at which to capture: 0- Pre: before, 1- Post: after
--kernelside (for --uplink)
The capture point is in kernel instead of in driver.
This option is always true and no longer required.
The capture point options
-f [module name.]<function name>[[:offset]|[:line number]]
The function name and the offset/line number in the function.
The default module name is 'vmkernel'.
The default offset into the function is 0 (the beginning of the function).
The line number must start with letter 'L' if it's file related
line number, or 'F' for function related line number.
(for 'Dynamic', 'IOChain' and 'TcpipDispatch' capture points)
--dvfilter <filter name>
Specify the dvfilter name for DVFilter related points
--overlay <overlay class name>
Specify the overlay class name for 'Overlay' capture point
--pkt-list-param-idx <num>
Specify the pktList index in function's parameter table, starting from 1
--pkt-param-idx <num>
Specify the pkt index in function's parameter table, starting from 1
--port-id-param-idx <num>
Specify the portId index in function's parameter table, starting from 1
--switchport option is required to filter packets by port ID
--mbuf-param-idx <num>
Specify the mbuf index in function's parameter table, starting from 1
--mbuf-array-param-idx <num>
Specify the mbuf array index in function's parameter table, starting from 1
--num-mbufs-param-idx <num>
Specify the mbuf array size index in function's parameter table, starting from 1
--vprobe-pkt-list <string>
If function offset is specified in '-f' argument, this is the vprobe
expression to access the pointer to pktList, e.g. "rax+18"
If file/function relative line number is specified in '-f' argument,
this is the C expression to access pktList, all variables must start
with '$' sign, e.g. "$pktListPtr"
--vprobe-pkt <string>
Vprobe/C expression to access the pointer to pkt, e.g. "rax+18"
or "$pkt", see argument --vprobe-pkt-list for details.
--vprobe-port-id <string>
Vprobe/C expression to access switch port id, e.g. "rax+18"
or "$portID", see argument --vprobe-pkt-list for details.
--vprobe-mbuf <string>
Vprobe expression to access mbuf, e.g. "rax+18"
or "$mbufPtr", see argument --vprobe-pkt-list for details.
--vprobe-mbuf-array <string>
Vprobe expression to access mbuf array, e.g. "rax+18"
or "$mbufArray", see argument --vprobe-pkt-list for details.
--vprobe-num-mbufs <string>
Vprobe expression to access number of mbufs in the array, e.g. "rax+18"
or "$numMbufs", see argument --vprobe-pkt-list for details.
--vprobe-symdbs <directory>
The parent directory of the symbol database.
--no-vprobe
Don't emit vprobe script to assist packet capture, the capture
function itself has dynamic capture point inserted
--compile-only
Print the vprobe script to standard output and exit
--script <FILE>
Start vprobe with the input .emt file to filter packets
-e, --experimental
Call experimental vProbe builtins
--clone-mbuf
Force to clone mbuf for capturing.
The original mbuf can be modified after capture, the dumped data
may be different from that seen at the capture point.
Flow filter options, it will be applied when set:
--srcmac <xx:xx:xx:xx:xx>
The Ethernet source MAC address.
--dstmac <xx:xx:xx:xx:xx>
The Ethernet destination MAC address.
--mac <xx:xx:xx:xx:xx>
The Ethernet MAC address(src or dst).
--ethtype 0x<ETHTYPE>
The Ethernet type. HEX format.
--vlan <VLANID>
The Ethernet VLAN ID, one of 0-4095.
--srcip <x.x.x.x[/<range>]>
The source IPv4/IPv6 address.
--dstip <x.x.x.x[/<range>]>
The destination IPv4/IPv6 address.
--ip <x.x.x.x>
The IPv4/IPv6 address(src or dst).
--proto 0x<IPPROTYPE>
The IPv4/IPv6 protocol.
--srcport <SRCPORT>
The TCP source port.
--dstport <DSTPORT>
The TCP destination port.
--tcpport <PORT>
The TCP port(src or dst).
--srcudpport <SRCPORT>
The UDP source port.
--dstudpport <DSTPORT>
The UDP destination port.
--udpport <PORT>
The UDP port(src or dst).
--vni <vni>
The VNI of flow, one of 0-16777215.
--vxlan <vxlan id>
The vxlan id of flow. This option is depreciated, use 'vni' instead.
--rcf <EXPR>
The tcpdump filter expression. You better not use this options
together with legacy pktcap-uw 5-tuples filter rules. You can use
them separately. For vni and vlan options of legacy pktcap-uw, you
can use them as before. For rcf option, please notice below three limits:
1) Do not set vlan in rcf option;
2) Do not set ip broadcast in rcf option;
3) Do not use rcf on ENS ports.
--rcf-tcp-data <EXPR>
Packet data content, such as, "GET", "GET /index.html"
or "HTTP/1.0 200 OK" for HTTP packet.
I'll cover one other scenario, how to packet capture to a file.
Ok, how do we send this packet capture data to file? Let me show you. First, we need to find a place to store the file. Find your hypervisor's datastore and record the path where you want files to be copied:
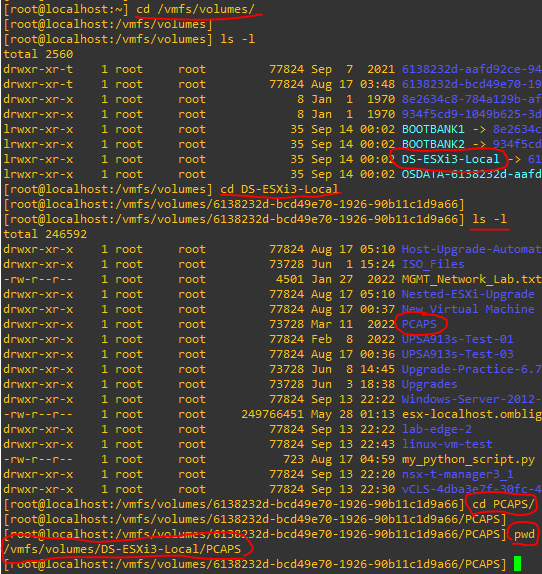
If you follow the above screenshot, you can see the steps:
1. Change directory to /vmfs/volumes
2. list out the directories to view what storage options you have. I picked local storage
3. When taking pcaps, I normally make a directory called pcaps to store the files. You can see PCAPS in the screenshot.
4. I change directory to PCAPS and list the path with pwd. Copy that pwd output to your text file.

Lets see what it looks like when we drop this command into the cli.


Next you'll need to download the file to your machine for analysis. There are 3 options for this. You can use the datastore browser built into vCenter, use the datastore browser for the ESXi host, or connect directly to the ESXi host with an FTP client and secure copy (SCP) the file off of the host. I'll show screenshots of each method and then a final image of the file open in Wireshark.
vCenter Datastore Browser

ESXi Datastore Browser

WinSCP FTP client

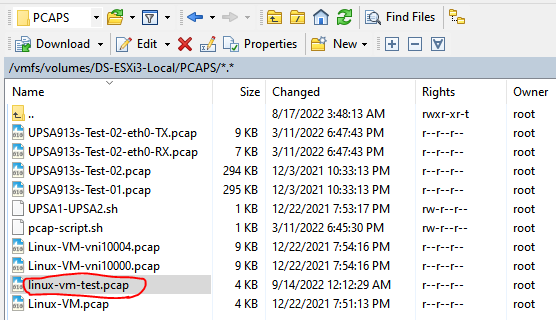
Open the file in Wireshark for analysis!


Comments
Post a Comment