Packet Capture Network Traffic Inside ESXi Hypervisor
The three components of computer infrastructure are considered compute, storage, and networking. When applications don't work properly, its often the case that networking is the first component to receive blame for failed application performance. In the case of virtualized workloads (i.e. applications running on virtual machines), we are fortunate to have a powerful troubleshooting tool which allows us to packet capture network traffic in an ESXi hypervisor. For this blog, I'm going to use an Hands On Lab (HOL) from the VMware website to demonstrate the process of doing a quick live packet capture. The output of the packet capture will be sent to the shell of the hypervisor. There are ways to sent the network traffic to a file so it can be extracted and analyzed by a packet analyzer tool, but that will be for another post.
First, lets start with heading over to the HOL website: https://labs.hol.vmware.com/

For this lab, I'm going to type NSX in the search bar to find an NSX HOL, "HOL-2003-01-NET - VMware NSX for vSphere - Getting Started".
 If you haven't registered an account with HOL, it will prompt you to do so when you try to enroll in the lab. I assume if you're reading my blog on the internet, you've registered for countless websites already and are familiar with the process of registration. I've registered already and will resume at the desktop of the HOL. Launch the browser and putty.

Login to vSphere web client with the following credentials:
Username: administrator@corp.local
Password: VMware1!
The point behind logging in here is to check where the virtual machines (VMs) are located. Take note of two VMs in the vCenter inventory, web-01a_corp.local and web-02a_corp.local. Open a web console to both VMs so we can initiate some network traffic with ping. Also take note of which ESXi host each VM is running on. That will inform us where to start the SSH session with Putty.
 VMs credentials are as follows:
Username: root
Password: VMware1!

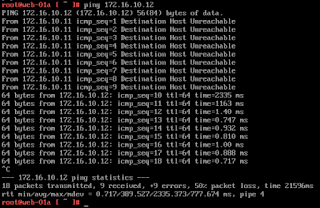
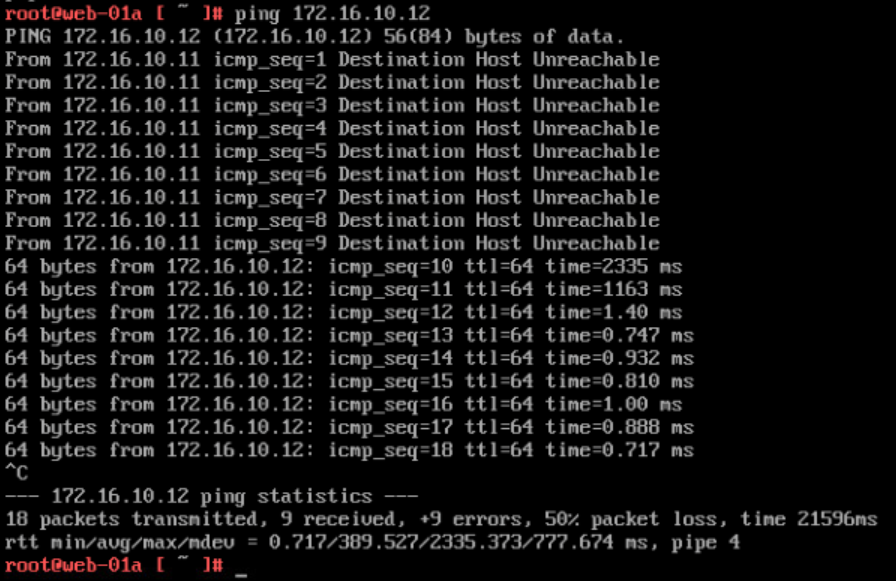
 Lets start a continuous ping between the VMs. You'll notice its not working at first. That is because this lab is designed to teach you how to administer NSX though a lab guide.

We don't want to follow those steps here, and the HOL developers are aware that such steps can be bothersome. We can have the lab completed automatically by some powershell scripts left on the desktop.


pktcap-uw --switchport 67108880 --capture VnicTx -o - |tcpdump-uw -envvvvr -
pktcap-uw --switchport 67108880 --capture PortInput -o - |tcpdump-uw -envvvvr -
pktcap-uw --switchport 67108868 --capture PortInput -o - |tcpdump-uw -envvvvr -
pktcap-uw --uplink vmnic3 --capture UplinkSndKernel -o - |tcpdump-uw -envvvvr -


At this point, I'm going to add grep to filter the results. Otherwise you will see every packet leaving the host from all virtual components using this vmnic. It quickly becomes too much information to be useful. Grep it down to the source ip address of the packet:
pktcap-uw --uplink vmnic0 --capture UplinkSndKernel -o - |tcpdump-uw -envvvvr - | grep 172.16.10.12

First, lets start with heading over to the HOL website: https://labs.hol.vmware.com/

For this lab, I'm going to type NSX in the search bar to find an NSX HOL, "HOL-2003-01-NET - VMware NSX for vSphere - Getting Started".


Login to vSphere web client with the following credentials:
Username: administrator@corp.local
Password: VMware1!
The point behind logging in here is to check where the virtual machines (VMs) are located. Take note of two VMs in the vCenter inventory, web-01a_corp.local and web-02a_corp.local. Open a web console to both VMs so we can initiate some network traffic with ping. Also take note of which ESXi host each VM is running on. That will inform us where to start the SSH session with Putty.

Username: root
Password: VMware1!


We don't want to follow those steps here, and the HOL developers are aware that such steps can be bothersome. We can have the lab completed automatically by some powershell scripts left on the desktop.

Once the powershell script runs, we should see ping packets successfully be returned. Navigate to ESXi host 2 in Putty and launch the connection.


Once you're at the ESXi shell, start with the command:
net-stats -l

It should produce a list of VMs (and other components) running on the hypervisor. In a production environment with hundreds of VMs running, you can modify the command by "piping to grep", which is a paradigm descending from Unix and Unix like operating systems. In my case, you might modify the command to look something like:
net-stats -l | grep web-02a_corp.local
Now we have the VM's port number and can insert it to the packet capture command. Generically, the ESXi packet capture commands are as follows:
ESXi Host - Live packet capture of VM traffic as it hits the vNic of the VM
pktcap-uw --switchport 67108880 --capture VnicTx -o - |tcpdump-uw -envvvvr -
pktcap-uw --switchport 67108880 --capture VnicRx -o - |tcpdump-uw -envvvvr -
---
ESXi Host - Live packet capture of a Virtual Construct (VM or VMK) as it hits the virtual or dv switchport
pktcap-uw --switchport 67108880 --capture PortInput -o - |tcpdump-uw -envvvvr -
pktcap-uw --switchport 67108880 --capture PortOutput -o - |tcpdump-uw -envvvvr -
---
ESXi Host - Live packet capture of a virtual or dv switchport connected to a vmnic (packet leaving and entering the host)
pktcap-uw --switchport 67108868 --capture PortInput -o - |tcpdump-uw -envvvvr -
pktcap-uw --switchport 67108868 --capture PortOutput -o - |tcpdump-uw -envvvvr -
---
ESXi Host - Live packet capture of a vmnic as packet enters or leaves the host (packet leaving and entering the host)
pktcap-uw --uplink vmnic3 --capture UplinkSndKernel -o - |tcpdump-uw -envvvvr -
pktcap-uw --uplink vmnic3 --capture UplinkRcvKernel -o - |tcpdump-uw -envvvvr -
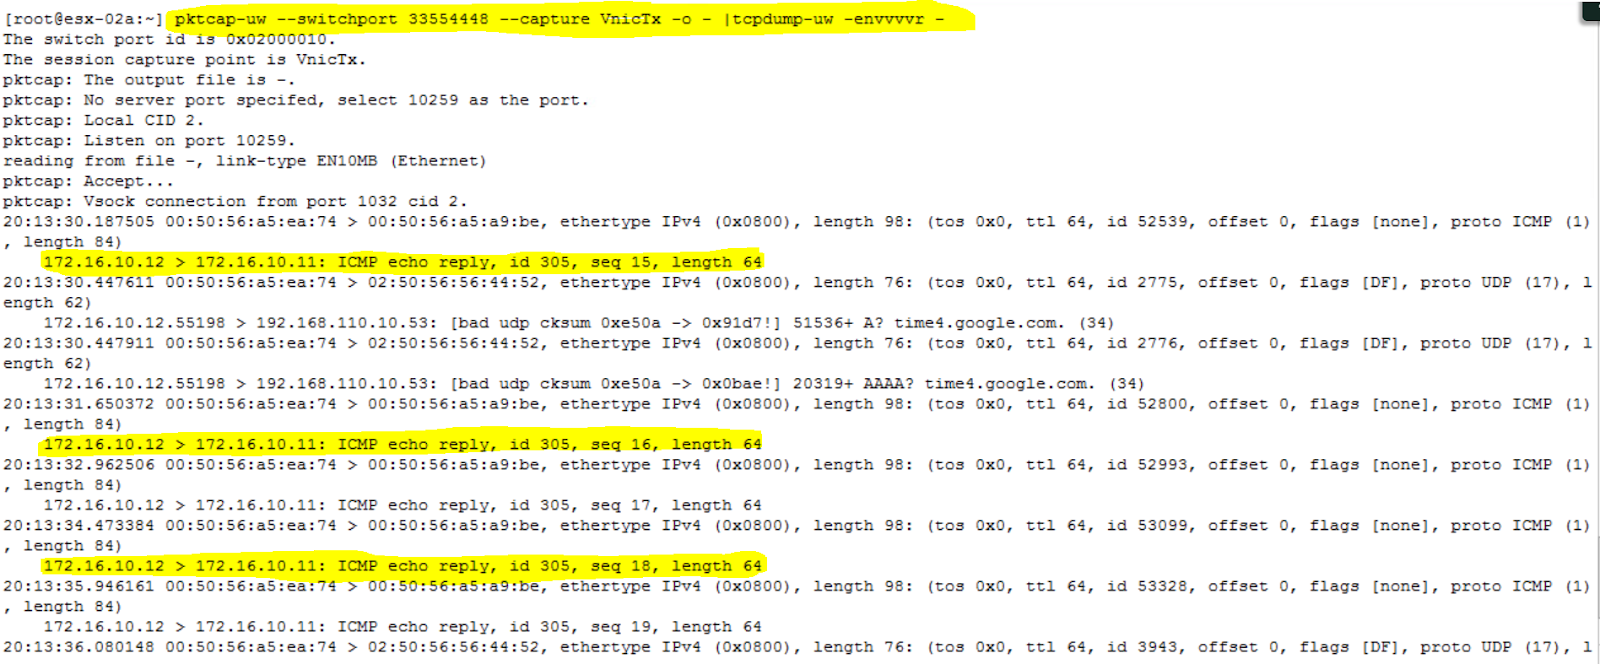
To capture a packet at the vNic of our VM, type in the following command. Notice that only one direction of traffic can be captured at a time, denoted by the VnicTx or VnicRx.
pktcap-uw --switchport 33554448 --capture VnicTx -o - |tcpdump-uw -envvvvr -
pktcap-uw --switchport 33554448 --capture VnicRx -o - |tcpdump-uw -envvvvr -
There are other capture points, four that I normally work with. vNic of the VM, VM's dvSwitch port ingress or egress, uplink's dvSwitch ingress and egress port, and finally, the uplink's physical manifestation, vmnic. Explaining everything I just said there can be its own blog post, but I'm not going to explain it here. This post is about performing packet captures. This final section will show a packet that has left the VM and egressing the the ESXi host. This is of major importance in a troubleshooting scenario because once the packet has left the host, the hypervisor no longer has control over what happens to that packet. So, I'll show how we packet capture the above packets leaving the host and that will be the end of this post.
We need to figure out what physical nic is supporting the virtual machine. The hypervisor has mapped these two components (vNic and vmnic) and we can discover that mapping by typing the following commands:
esxtop

push "n"

push "q" to exit the esxtop output and using this information we saw in the screenshot above, we can now packet capture this packet as it leaves the host:
pktcap-uw --uplink vmnic0 --capture UplinkSndKernel -o - |tcpdump-uw -envvvvr -
pktcap-uw --uplink vmnic0 --capture UplinkSndKernel -o - |tcpdump-uw -envvvvr - | grep 172.16.10.12

We now have evidence that this packet is leaving the host. Were this a real troubleshooting scenario, you now have enough evidence to say the packet has been sent to the network. Depending on your organizational structure, either call in the network team, or start looking at your switch configuration to figure out why the packet isn't getting to its destination. Alternatively, if you demonstrate that the network is functioning as expected, you should have enough leverage to say definitively that the application problems are not being caused by the network!


Originally, I stated that the vSphere Web Client username was administrator@vsphere.local. It should actually be administrator@corp.local and I have changed the post to reflect this requirement. Sorry for any frustration caused :o)
ReplyDelete